


In the face of the COVID-19 pandemic, we stare down an uncertain economic future. The crisis has transformed the day-to-day workings of our life and culture as we know it. Namely, the economy. Due to widespread social distancing measures an economic downturn is already upon us, with a full-on recession looming. The unprecedented nature of this crisis ensures even the most predictable and mundane economic affairs have become unpredictable. To make the most informed and impactful decisions on our economic security, we must rely on real-time data while also leaning on historic observations of previous recession wages.
PayScale’s data is capable of both. In this analysis, we leverage millions of salary profiles from respondents of PayScale’s Salary Survey. First, we look at the behavior of recession wages, using data from the Great Recession of 2008-2009. We use PayScale’s salary profiles from 2007 onwards to understand how different cohorts of graduates saw wages penalized by the recession. We also use robust occupational salary and employment data from the Bureau of Labor Statistics (BLS) to bolster our understanding of changes in recession wages and employment between 2006 to 2013.
Next, we take a snapshot of wage dynamics in recent months to determine which groups are struggling or thriving in the chaos of this novel crisis. For a controlled comparison, we leverage the same seasonable time frames from the previous year. These measurements of wage growth are provided for various data cuts, including occupations, industries and metro areas.
Flattening the [Wage Growth] Curve
Staying indoors and self-isolation will ultimately help flatten the curve of COVID-19 cases, but these measures have had a disastrous impact on the global economy. The decline in economic participation creates a downward spiral of decreased consumer spending and further unemployment. We now face the worst employment crisis in U.S. history, with 30.3 million unemployment claims in a six-week period. But what about pay? How do recession wages generally behave and what can we expect in the midst of our current economic turmoil? It turns out that flattening the curve of virus spread may indirectly mean flattening wage growth.
Historically, recessions generally lead to a spike in involuntary unemployment rather than a fall in nominal wages (wages not adjusted for inflation to reflect true purchasing power). Besides putting a damper on employee morale, neglecting to give pay increases could cause the best workers in an organization to leave. Instead, companies take a more strategic approach by laying off workers who are poor performers or have less of a business impact. Competitors can even poach an organization’s workers once lay-offs have already occurred, in an attempt to not only secure the better performers remaining but also deal a blow to their already weakened rival. This is all the more reason that companies tend to proceed with pay raises even throughout a recession, by using the resources made available via layoffs.
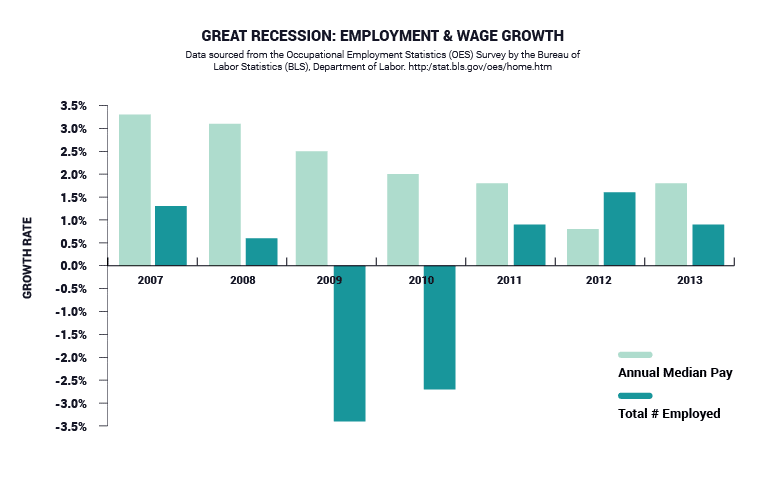
However, as unemployment increases and competition for talent isn’t as high, recession wage growth slows rather than being driven up as it would in a tight labor market. BLS data shows national nominal wage growth leading up to the Great Recession was about a 3.0 percent increase per year. In 2008 and 2009, annual growth in nominal wages slowed to 2.5 and 2.0 percent, respectively. Subsequent years post-recession show nominal wage growth slowing even further, to 0.80 percent growth by 2012. Indeed, nominal wage growth doesn’t begin to recover until 2013. In contrast, the total number of employed fell 3.4 percent in 2009 and did not see positive growth until 2011. In other words, employment numbers fell during the recession while nominal wages grew, albeit at a slower rate.
BLS data also shows most occupational and industrial groups fell in line with this trend in recession wages, with a few exceptions. The total number of employed in community & social services occupations grew during the Great Recession. Given the role these occupations play in providing financial and social relief to a community, it is no surprise to see an increase in the number of these workers during a recession. Other groups, such as sales occupations, did see periods of negative nominal wage growth amidst the recession – this is likely attributable to a decrease in sales commission. However, nominal wages across all groups generally show a positive trend over time.
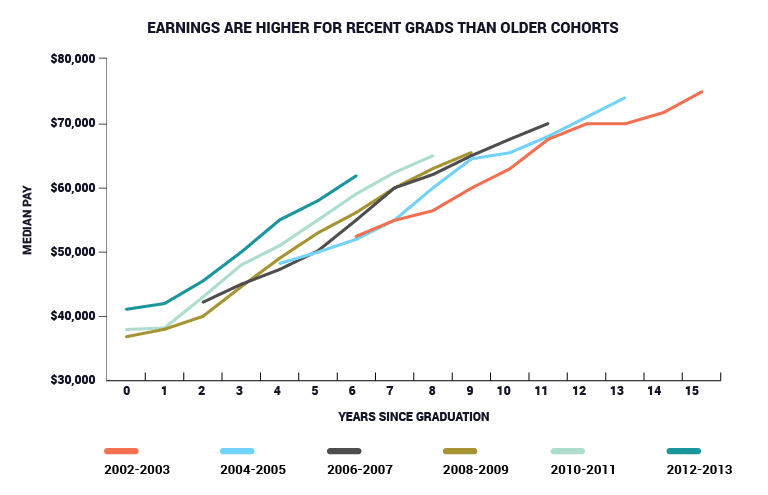
In PayScale’s data, we observe similar trends in recession wages. As PayScale’s data is limited prior to 2007, we opted to look at recession wages for specific cohorts of graduates by grouping profiles into the number of years since graduating. We looked at graduation years from 2000 to 2018 and observed wages for each graduating cohort post-recession to understand how quickly wages picked back up in terms of growth. This method provides an adequate proxy for a ‘recession penalty’ on the growth of wages as new graduates enter the workforce over time.
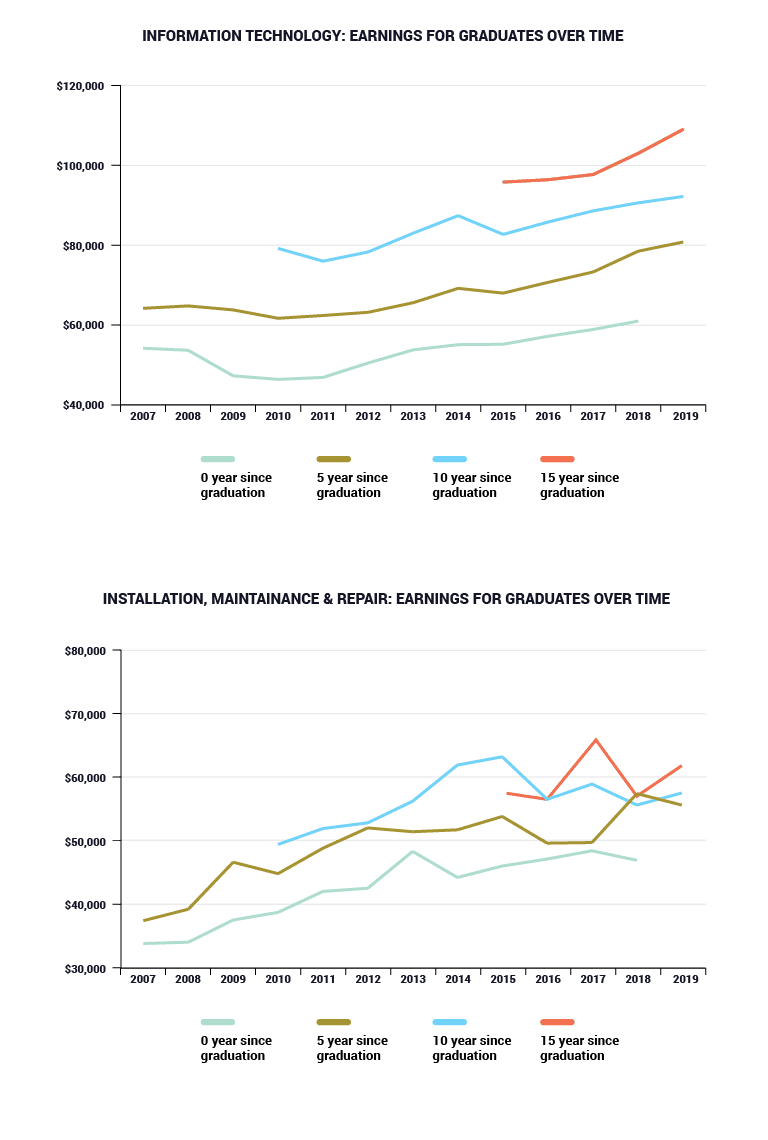
Overall, we find that the Great Recession did slow the trend of higher earnings for each successive cohort. Wage growth for the Great Recession cohort, graduates from 2008 to 2009, trended almost exactly in line with wage growth for the preceding cohort, rather than distinctly higher. As we see in BLS data, wage growth does not recover until 2013-2014 for most groups. Looking at the data by industry, most service sector wages have moderate growth across all years post-graduation. Higher paying industries such as tech and real estate rebounded at a faster clip. In this case, the rebound of tech wages likely spurred an increase in real estate activity as tech companies are large consumers of office space.
Blue collar occupations have extremely narrow pay bands, 15 years after graduating some of the salary data suggests a flatlining of growth. In contrast, professional white-collar jobs such as IT and legal occupations show large stratification in pay. These professions also rebounded by 2013 to have high growth rates in wages. United States coastal cities show a similar trendline to professional services jobs, with hot job markets like Seattle, San Francisco and New York showing wider stratification in pay bands and much faster growth. Midwestern cities such as Cincinnati or Cleveland still have sluggish wage growth.
While recession wage recovery for different sectors is largely dependent on circumstantial factors that will be inherently different during a pandemic, both PayScale and BLS data sets suggest recession wage growth recovery can be expected after a certain lag period post-recession. Government stimulus packages were implemented in the Great Recession just as they are now. Although different sectors of the economy are in crisis because of the novelty of COVID-19, historic data sets the precedent that a stimulus package can likely offer tangible relief over time.
Recession Wages in a Crisis: Same Storm, Different Boat
Sometimes the most comforting reassurance in times of a crisis is that we’re all in the same boat. While it is true that all of us face the same larger threat of COVID-19, we aren’t facing it equally. Depending on your job, industry, location or other factors, your economic and social well-being may be facing greater uncertainty. It’s the same storm, different boat.
We observed wage growth in recent months across occupation, industry and metro groups to determine how different sectors of the economy are responding to the COVID-19 crisis. Here, we discuss wage growth rates for 12-month and monthly intervals.
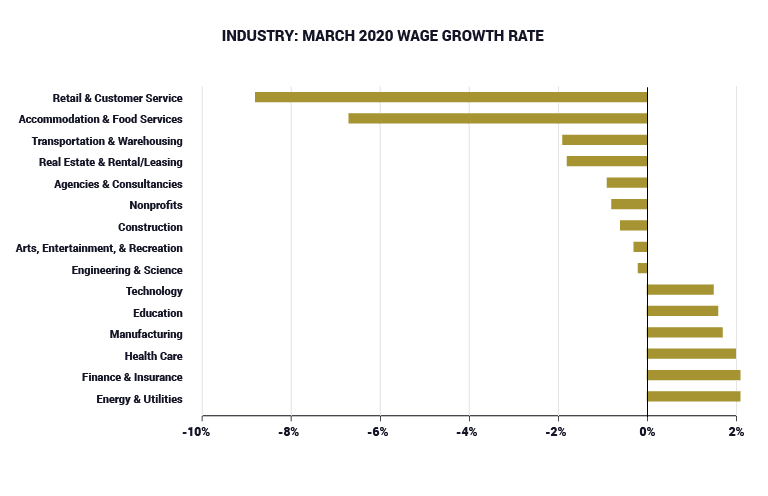
Over a 12-month period, we find that across all industries, occupations and metro areas wage growth has generally flatlined. Between April 2018 and April 2019, average wage growth among industries was 1.6 percent. Between April 2019 and April 2020, however, it is just 0.5 percent. But this is the average of all industries. The Technology industry has shown the greatest wage growth in the last 12 months, at 3.5 percent. Retail and Customer Service saw a fall in wages of 4.1 percent in the same period and an 8.8 percent fall in wages in just the month of March. Energy & utilities, an industry long held as having recession-proof revenue and rates set by regulators, saw the greatest wage gains in March at 2.1 percent.
Sales, Retail and Food Service & Restaurant occupations had the worst dips in wages over the last 12 months, with wage growth rates at -0.8 percent, -0.7 percent and -0.6 percent, respectively. Retail and Food Service & Restaurant jobs were also among those who suffered the worst in March, with a fall in wages of 3.4 and 6.6 percent, respectively. Legal jobs, however, had the largest drop in wages of 7.3 percent. This may be a result of courthouses and other legal systems grinding to a halt due to restrictions and protections implemented because of COVID-19. Information Technology, Transportation and Social Services occupations saw the largest gains over the same 12-month period. Wages for these jobs grew at 1.9 percent, 1.7 percent and 1.7 percent, respectively.
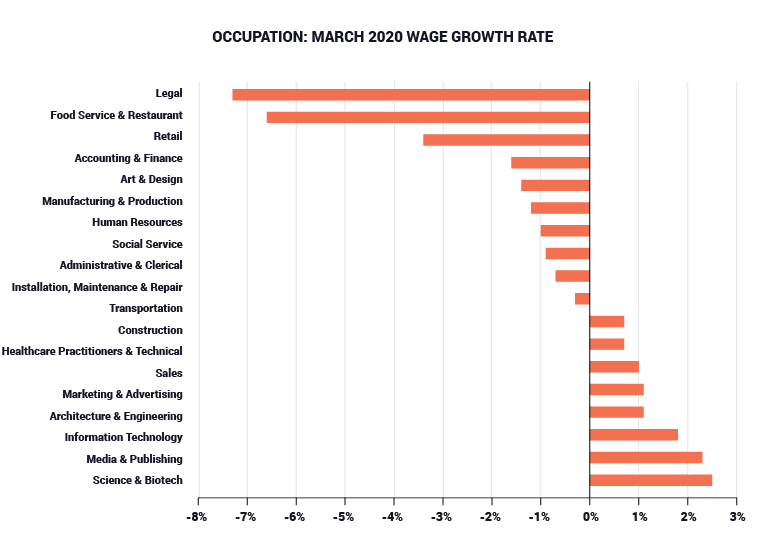
Given social distancing and a decline in consumer spending, the disparate negative impact on retail and restaurants is to be expected. Another consideration is that although the steep fall in wages are dramatic, this is also a function of looking at wages over shorter monthly periods. As we see in historic recession data, it is more likely to see wages stagnate around plus or minus 1 percent over longer periods rather than a long-lasting drop in wages. Short periods of negative wage growth will occur, but historic recession data tells us these losses will recover over time.
The average wage growth across all metro areas was 3.1 percent between April 2018 and April 2019. Between April 2019 and April 2020, average wage growth has dropped to a dismal -0.1 percent. Houston was the worst hit among metro areas in the last 12 months. The well-known oil city saw a 3.5 percent dip in wages since last April and a flat 0.0 percent growth in the month of March. Given the Saudi-Russia price war and lack of demand due to COVID-19, prices on oil have entered peculiar negative territory. The week of April 20th, 2020, West Texas oil was priced at -$37.63 a barrel. The unprecedented behavior of the oil trade casts an uncertain future for the Houston economy or other economies heavily influenced by oil.
Recession Wages Can Start with Job Offers
Organization’s prompting slowed wage growth for their current employees may opt for an alternative strategy to defend against a troubled economic environment. Job offers, the starting salary initially proposed by a prospective employer to a prospective employee, are a useful measurement to determine how companies are coping in an economic downturn. Declining job offer wages may suggest if struggling employers are looking to save money in the long term by stifling salaries right out of the gate. Growth or decline in job offer wages for new hires can also be an effective indicator of how competitive talent acquisition has become in that market sector.
PayScale collects job offer data from respondents looking to evaluate a job offer in our survey. Below, we use only job offer profiles to determine growth in offered salaries for different groups.
Profiles from the last 12 months have shown growth in job offer wages grinding to a halt compared to where they were in the previous year. Average growth in job offer salaries from April 2018 to April 2019 was 4.2 percent across all industries, now it sits at an average of 0.3 percent. For metros too, a healthy 5.8 percent growth in job offer salaries was observed in the previous year, but now growth is stagnant at 0.1 percent.
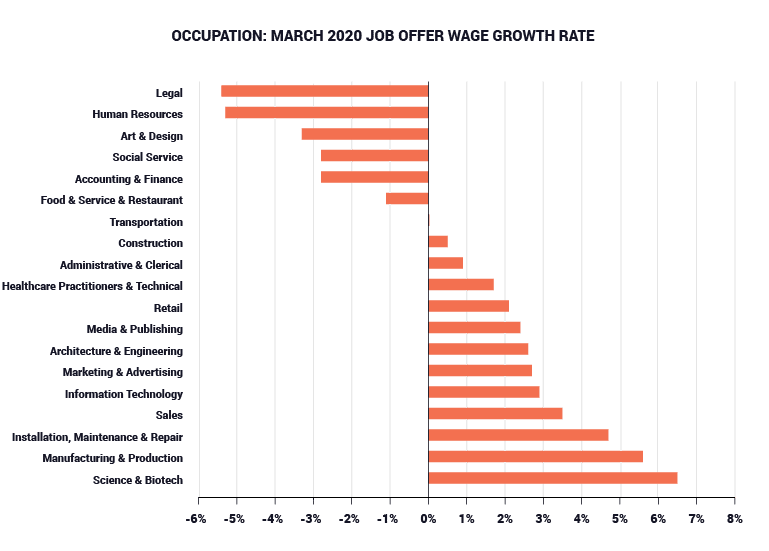
Expectedly, the Retail & Customer Service industry has been hardest hit. In the last 12 months, job offer dollars fell 8.5 percent. In the month of March, job offer salaries took a staggering dip of 14.4 percent. Retail occupations did not fare better than the industry as a whole. These workers suffered the worst growth in job offer salaries over the last 12 months, at -0.8 percent. Again, legal occupations in the month of March saw dismal growth, with job offers salaries dropping 5.4 percent.
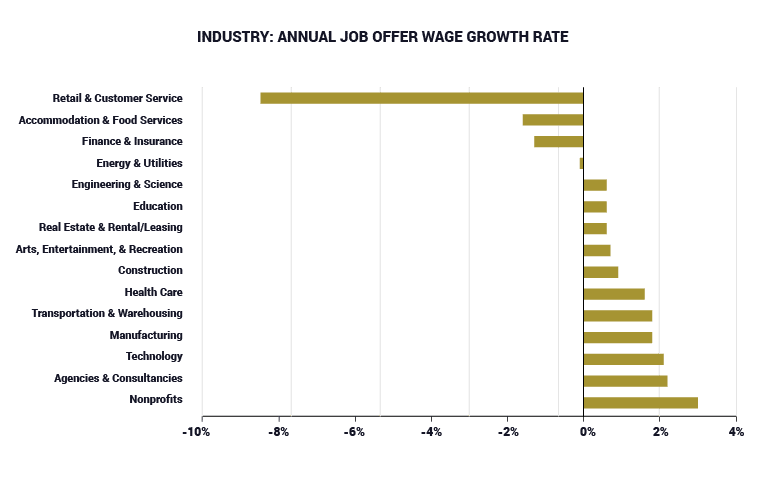
Sectors where job offers have fared better are Nonprofits, Agencies & Consultancies and Technology. With that in mind, consider there is a nonprofit pay cut that workers may be impacted by. Over the last year, these industries had job offer wages grow at 3.0 percent, 2.2 percent and 2.1 percent, respectively. Occupations in science & biotech saw job offer wages grow by 6.5 percent in March, indicating notable competition for talent acquisition in these fields even amidst (or perhaps as a result of) COVID-19.
Consistent with its incumbent wage growth data, Houston came out with the worst growth in job offer salaries in the last 12 months, at -4.6 percent. New York, at the forefront of the pandemic and generally a strong performer in wage growth, settled in the middle of the pack at a flat 0.0 percent job offer salary growth in the last year. Nashville job offer salaries have proven resilient, with a 3.0 percent increase in the last year.
An Uncertain Conclusion
Real-time data tells us that wages are slowing down, with sectors largely reliant on consumer spending being hit the worst. As this socio-economic crisis evolves into recession territory, historic data suggests wage growth will dip throughout the crisis and linger onwards until a lag period has passed and wages will recover. The extent of this dip in wage growth and the time needed for recovery are uncertain, if recession wages of 2008-2009 are any indication, it could be four to five years. Predicting how the coming months and year will unfold in the current economic climate is an unprecedented challenge. The trends in economic recovery we observe in historic recession wages are more hope than promise in the face of COVID-19. However, these metrics can still be an asset in distilling our expectations as this crisis develops.
