Payscale’s 9th Annual Salary Budget Survey
In the 2024-2025 salary budgeting season, HR leaders and compensation professionals must determine their pay increase strategy for the coming year. Payscale’s 2024-2025 Salary Budget Survey (SBS) provides unparalleled insights on projected salary budget submissions from 1,550 organizations collected between May and June of 2024.
Fill out the form to download the free report.
Salary budgets for pay increases will decline in 2025
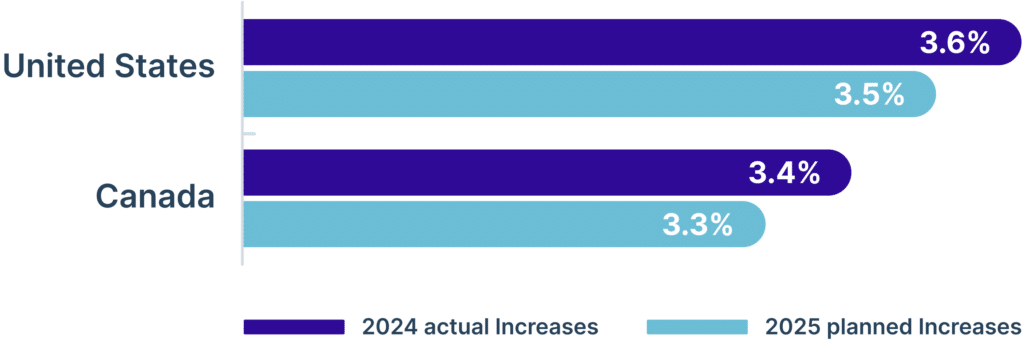
U.S. employers plan on 3.5 percent salary budget increases for 2025. Canada employers plan on 3.3 percent increases. This is a decline from 3.6 percent and 3.4 percent respectively for the pay increases employers actually gave in 2024.
The stabilization of inflation along with a loosening of labor market conditions is likely what is leading to planned salary increases diminishing slightly. However, it should be noted that base pay increases are projected to remain higher than 3 percent, which was the average before the COVID-19 pandemic.
Reasons for salary budget changes in the U.S.
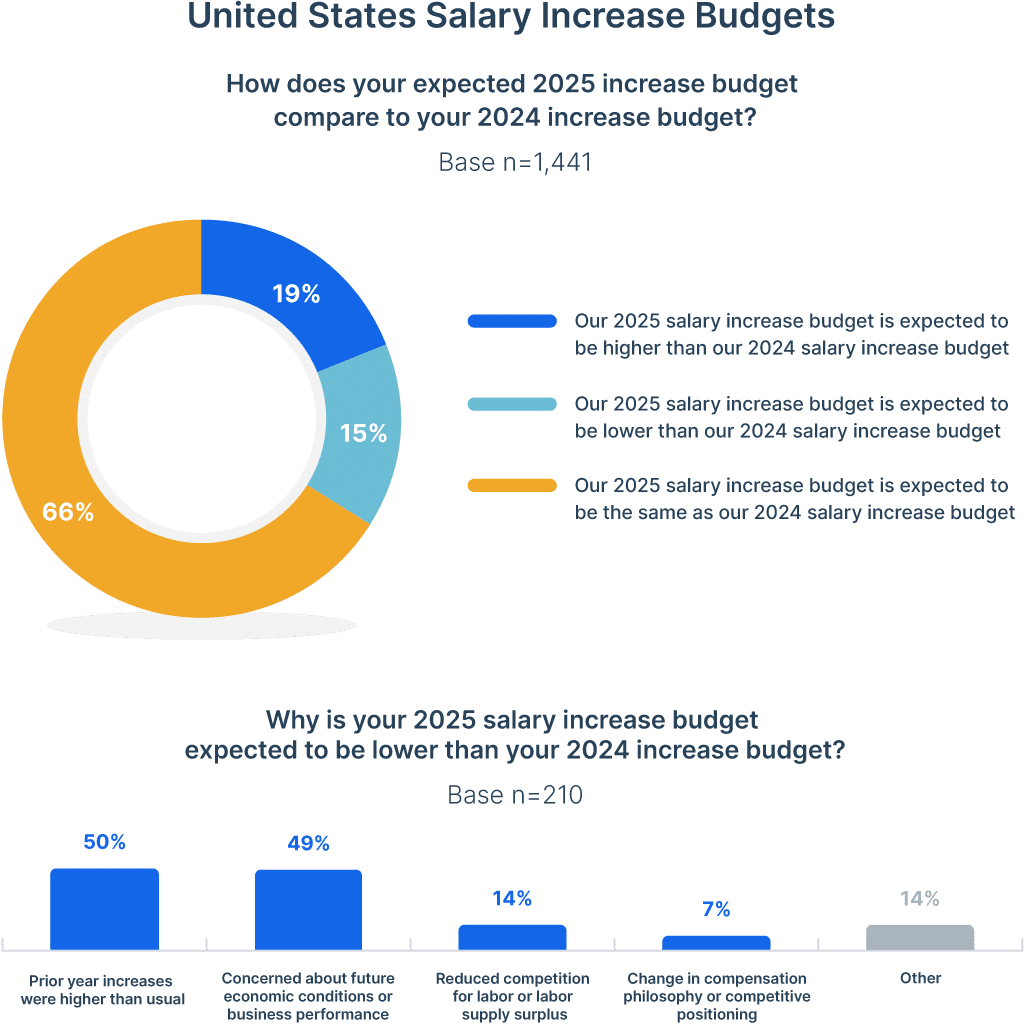
In the United States, only a small portion of organizations (19 percent) anticipate a salary increase budget that is higher than last year. The majority of organizations expect salary budgets to remain the same.
In the United States, the primary reason organizations said they lowered pay increases is that increases were higher in prior years. Concern about economic conditions was the second reason. However, organizations that said they are increasing budgets cited increased competition for labor as well as improved economic conditions. Salary budgets and planned pay increases vary by industry.
The full report shows the breakdown of salary budget increases by industry groups, sectors, FTE counts, revenue, regions, and individual states for each employee group studied. This level of detail provides employers with niche data specific to their size, industry, and location that can empower them to make informed decisions for their employees.
Reasons for salary budget changes in Canada
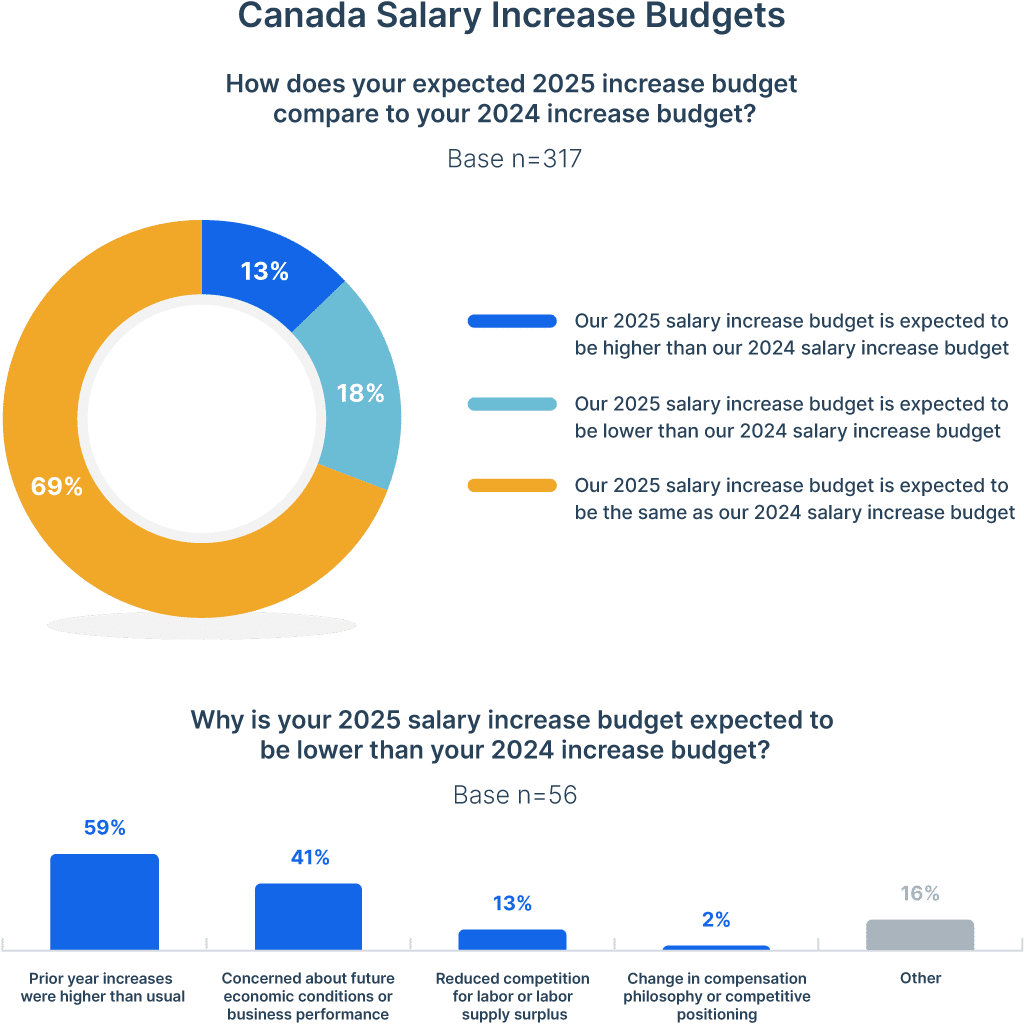
In Canada, an even smaller portion of organizations (13 percent) anticipate a salary increase budget that is higher than last year. The majority of organizations expect salary budgets to remain the same.
In Canada, the primary reason organizations said they lowered pay increases is also because increases were higher in prior years. Concern about economic conditions was also the second reason. Organizations that said they are increasing budgets cited increased competition for labor as the first reason, but the second reason was that prior increases were lower than usual.
The full report shows the breakdown of salary budget increases by industry groups, sectors, FTE counts, revenue, and provinces for each employee group studied. This level of detail provides employers with niche data specific to their size, industry, and location that can empower them to make informed decisions for their employees.

Methodology
Payscale clients and contacts were invited to participate in our Salary Budget Survey May-June of 2024, resulting in 1,550 useable submissions. Payscale’s Salary Budget Survey is broken out by employee groups, geographic segments, industry groups, and key firmographics. It includes actual salary increases from 2024, planned salary increase budgets for 2025, and salary structure increase budgets. The report also includes promotional increase budgets for the United States and Canada.
Respondents were asked to submit data for the United States, Canada, and selected international locations for four employee groups:
- Non-exempt employees
- Exempt (non-management) employees
- Managers
- Officers and executives
Respondents were instructed to enter no response for increase programs that do not exist in or were not applicable to their organization, and to enter a response of “0 percent” for programs that exist but were budgeted to receive no increase for the year in question. 0% responses were included in the calculations for the figures reported. A minimum of five responding organizations was required in order to publish. Not all participants provided all types of increases, so Total Increases reported may not equal the sum of other increases reported.
Download the report for the full methodology.
